Dynamics AX SSRS Reporting Tip: Building a Gantt Chart with Multiple Ranges Per Row and Locating an Error in the Report
I’m writing the series of posts on Dynamics AX SSRS reporting, describing how to configure and install Dynamics AX SSRS reports. Today, I’ll explain how to create a Gantt сhart with multiple ranges per row and
Issue:
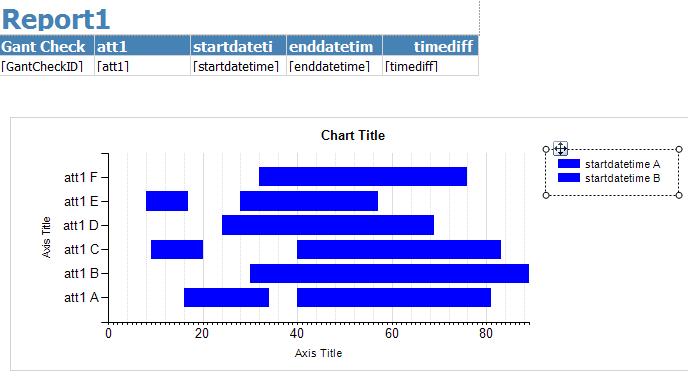
Sometimes you need to build the Gantt chart in SQL Server Reporting Services with multiple ranges per row. For example, Task 1 takes place 5 times and Task 2—3 times, but they must be on the same row.
Solution:
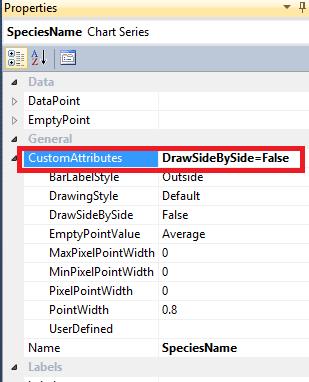
The rows usually follow each other: every new block is displayed on the new line of the chart. To display them in the single row, set Custom Attribute DrawSideBySide=False in the Chart Series properties.
There is another tip on Dynamics AX SSRS reporting I want to share with you today.
Issue: Locate an Error in the SSRS Report
It is hard to find where exactly the error in the SSRS report is. The report’s design can have hundreds of controls and expressions, but there is no hint from system on how to solve it. For example, in this invoice report, the error is in the expression:
![]()
Solution:
There is a tricky function Ctrl+F that must be called when the design mode is opened to access RDL (Report definition language). There is no standard way to open it. All necessary information can be found here, e.g. controls, expressions etc.

Now you can easily find the error in the Dynamics AX SSRS report.